Markout
Last updatedTheory behind the bid-ask spread, adverse selection, stale-quote sniping and the markout
Papers: Glosten–Milgrom (1985) [GM 1985], Glosten (1994) [G 1994] , Budish–Cramton–Shim (2015) [BCS 2015]. Kyle (1985) is background.
Understanding Order Book, theory and empirical study
1. Order book, spread and zero profit condition#
1.1 Order book#
The book is the list of standing orders to sell (asks) and to buy (bids), ranked by price.
- Best bid : highest price a buyer (provider) is waiting to pay. Best ask : lowest price a seller (provider) is waiting to accept.
- Spread . Mid-price . Half-spread .
- A limit order names a price and waits; it may never trade. A market order trades immediately against the best prices, and a large one walks up the book level by level.
in [GM 1985]: a liquidity provider (the specialist) quotes a bid (buy) and an ask (sell). Customers arrive one at a time with market orders. A fraction are informed (they know the value ); the rest are noise traders who buy or sell at random. The provider cannot tell who is who.
For the provider, his guess of the value is . The provider only trades when someone chooses to trade with his quote, so he must price the quote conditioned on being traded with.
For the bid side, the provider is willing to buy at , “Someone wants to sell” is bad news about , so the provider must buy below . For the ask side, the provider is willing to sell at , “Someone wants to buy” is good news about , so the provider must sell above .
Condider a trade in which a taker buys at the ask (the provider sells) . Among buyers, let be the share of informed trader among buyers, and let be what an informed buyer knows the share is worth. From a noise buyer the provider gains from the half spread : the noise trader pays for something worth in expectation of public knowledge.
1.2 Zero profit condition#
[GM 1985] assume that liquidity providers compete with each other and this competition drives expected profit to zero (zero profit condition) (Bertrand Competition: If one provider positive expected profits, other providers will quote a tighter spread and win the order flow, so his profit cannot persist.)
So the spread is what noise traders pay to cover the provider’s losses to informed traders. More informed flow means a wider spread. Zero profit is an assumption, not a fact. It comes from competition among providers, and it removes one degree of freedom. In reality market makers earn money: markets are not perfectly competitive.
[GM 1985] prices one quote. [G 1994] puts the same logic into a limit order book.
Many patient traders post limit orders; investors send market orders. A market order hits the book level by level. Each level is priced at the expected value given that the order is big enough to reach it, and big orders are more likely to be informed.
Small trades pay a positive spread, large trades pay more per share. Limit orders profit on small trades and lose on large informed ones, about zero on average.
2. Stale quotes and sniping#
Now suppose nobody has private information. The provider quotes around the value : bid , ask . If the value jumps by and the provider has not yet updated, the ask is stale. It can be picked off only when ; the sniper’s profit is .
Value jumps , quotes are (). There are trading firms: 1 provider and 3 snipers. All see the news at the same time and the exchange processes messages one at a time in random order. (Here snipers use Immediate-Or-Cancel order i.e. IOC order)
| Provider | Each sniper | |
|---|---|---|
| Wins the race | (must beat all three) | each |
| If first | cancels safely | buys at 51 something worth 53: |
| If not first | sold at 51 something worth 53: | order cancelled: |
| Expected per jump |
The provider loses on average even though nobody knows more than anybody else. He earns it back from investors through a wider spread.
In [BCS 2015], free entry makes profit zero after speed costs(expected profits as a sniper minus the costs to speedup), and the cost is borne(paid) by investors(noise traders). An informed trader only trades if his edge beats the cost of crossing the spread. Buying at the ask costs above the mid, so an edge below gives negative expected profit and he does not trade.
| Informed trader (GM, Kyle) | Latency sniper (BCS) | |
|---|---|---|
| Knows | private information about fundamentals | the same public information as the provider |
| Edge | knowledge: sees the true value earlier | speed: acts before the provider can cancel |
| Risk | can simply be wrong on a given trade | almost none (IOC order is cancelled if he loses) |
3. Who gains, who loses#
- Noise traders pay the spread to get their trade done right away rather than wait. This is a fee for speed, not a pure loss.
- Provider earns the spread from noise traders and pays informed traders [GM 1985] and snipers [BCS 2015]. Expected profit is about zero under competition (Bertrand Competition).
- Informed traders / snipers gain on average when their edge (information or speed) exceeds the half-spread.
For a market to exist some participants must be willing to lose on average. If everyone were rational and equally informed, nobody would trade (Milgrom–Stokey no-trade theorem).
4. Price discovery, Markout and Price Impact#
4.1 Price Discovery#
Price discovery is how information enters the price. Markout path is a consequence of the price discovery and is the way we mesure it.
| Glosten–Milgrom | Budish et al. | |
|---|---|---|
| Information | held by informed traders, unknown to the provider | public: provider and takers see it at the same time |
| Enters the price through | informed trades and the provider’s Bayesian update | the provider’s cancel, slow and costly, so stale quotes get sniped |
| A trade tells us | something new | nothing new |
In [GM 1985] you (provider) do not know the information; someone (investor) trades and you update. In [BCS 2015] you know it already, but it still has to go through trades and cancels, and that is costly.
4.2 Markout#
For one trade with direction ( if the taker buys, if sells), price , and mid a time later, we define the markout of the trader (taker) is:
Here , , since (the information at time contains the information at time and this trade), we have that:
is random from the view point of , but averages over the information that arrives between and thus integrates out the new information.
The future mid is an unbiased but noisy estimate of , and the trade price is known (the trade price). So one markout of one trade is one noisy observation of , and we need many observations (LLN) before the average converges.
| Object | What it is | Example (, ask ) |
|---|---|---|
| One trade | a single observation, very noisy | can be positive or negative |
| One trader, all trades | a wallet’s average over its trades: that trader’s edge | informed wallet , noise wallet |
| All traders | all takers mixed together, |
Zero profit predicts that only the last one is zero. The middle one is what we look for in the data: wallets whose average markout is significantly different from zero.
4.3 Price Impact#
We can decompose the markout into a part that is known at the time of the trade (the half-spread) and a part that is revealed afterwards (the price impact).
The price impact contains the information revealed by the trade, , plus noise from news arriving between and . The noise has mean zero given and the trade, so the average price impact over many trades isolates the information content of the trade.
5. Example: taker markout in Polymarket BTC 5-minute markets#
5.1 Setup#
- Data. Pendulum mirror on Oak (
pmxt/v2, order book and trades with millisecond timestamps), Polymarket data-api (wallets) and gamma (market info, resolution). - Sample. 2026-08-06, 288 five-minute cycles. This is before the switch to 60-second TWAP settlement (2026-08-07), so every cycle settles on the Chainlink closing price.
- Markout, in cents per share, always for the Up token:
- for a taker-long trade (buy Up or sell Down), for a taker-short trade (sell Up or buy Down). The price of a Down trade at is converted to .
- is the Up mid-price . At we use the book just before the trade (the trade timestamp minus 180 ms, because trade timestamps in pmxt are about 100–300 ms later than the book). Afterwards we use the last two-sided book at . Once the market has settled, is replaced by the final value .
- Reading the curves. The horizontal axis is , the seconds since the trade, not the time within the cycle. At the markout equals minus the half-spread, the cost paid at the trade. The maker’s markout is the mirror image (the opposite sign), so it is not drawn.
- Averaging. Equal-weighted (blue): every trade counts the same. Volume-weighted (orange): weights are shares. In the 288-cycle plots the shaded band (equal-weighted) and the thin orange lines (volume-weighted) are 95% confidence intervals clustered by cycle.
- Sample filters and limits. Gross of fees. Trades whose price falls on the wrong side of the reference quote (
wrong_side, about 2.4%, mostly in the last seconds before the close) and trades with no mid-price are dropped. About 5% of trades are missing from pmxt because of WebSocket drops and are also dropped. Scripts:scripts/btc5m/in the research repo.
5.2 One cycle: btc-updown-5m-1786057200#
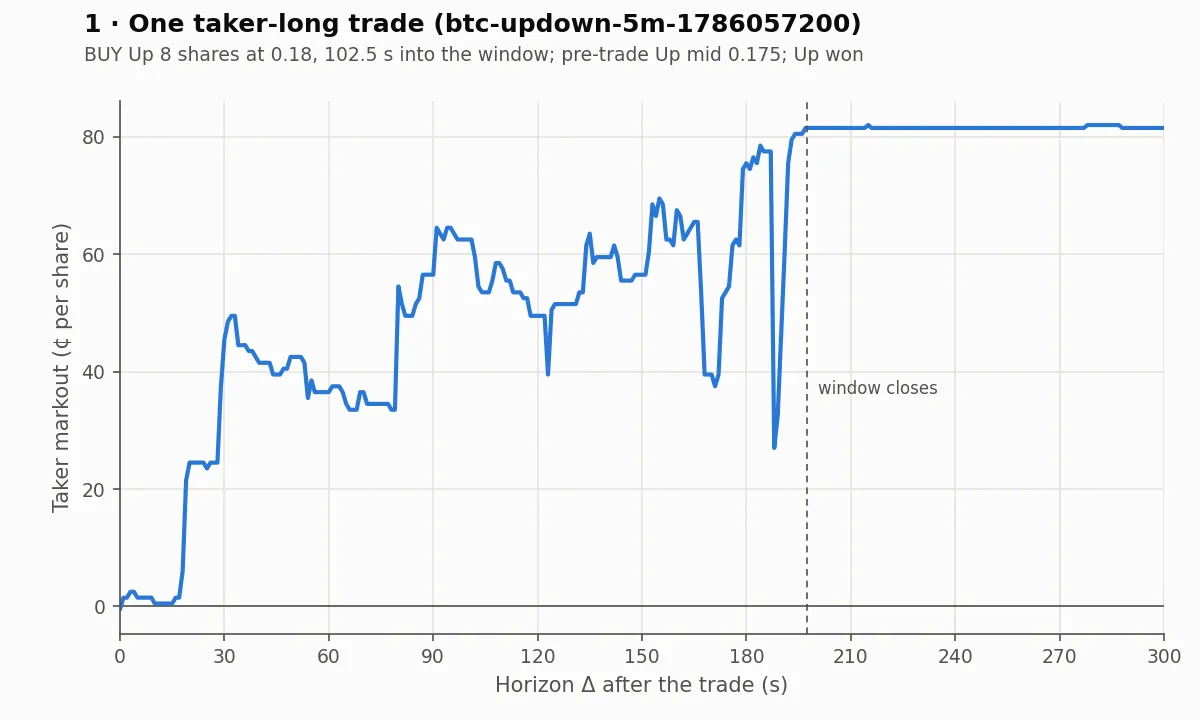
2026-08-06 23:00–23:05 UTC, Up won. The book was very volatile in the last 10 seconds (Up dropped from about 0.95 to about 0.3) without flipping the outcome.
One trade (Figure 1). A taker bought 8 Up shares at 0.18, 102.5 s into the window, with a pre-trade mid of 0.175. The markout at is about ¢ (half-spread). The dashed line marks the close of the window; after it the curve is flat at the realized payoff.
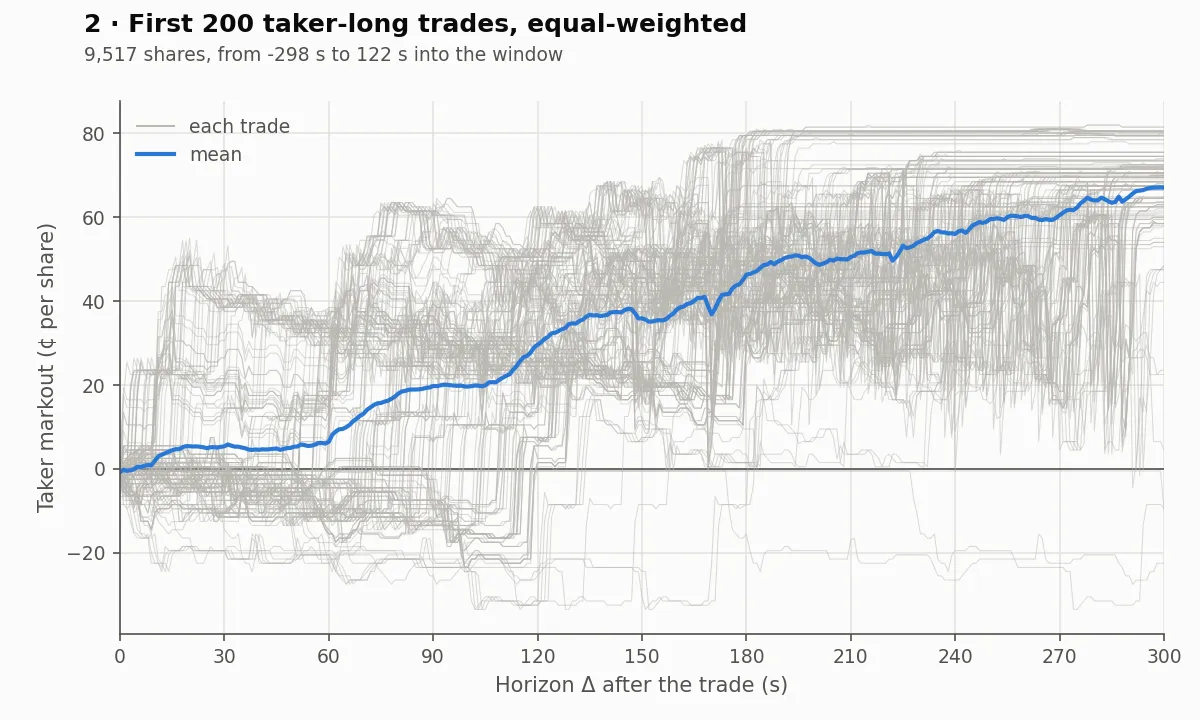
The first 200 trades (Figure 2). Gray lines are single trades and the blue line is their equal-weighted mean. The trades run from 298 s before the window opened to 122 s into it (negative time means before the open).
| Figure 1. Markout of one taker-long trade. | Figure 2. First 200 taker-long trades, individual curves and their mean. |
|---|---|
 |  |
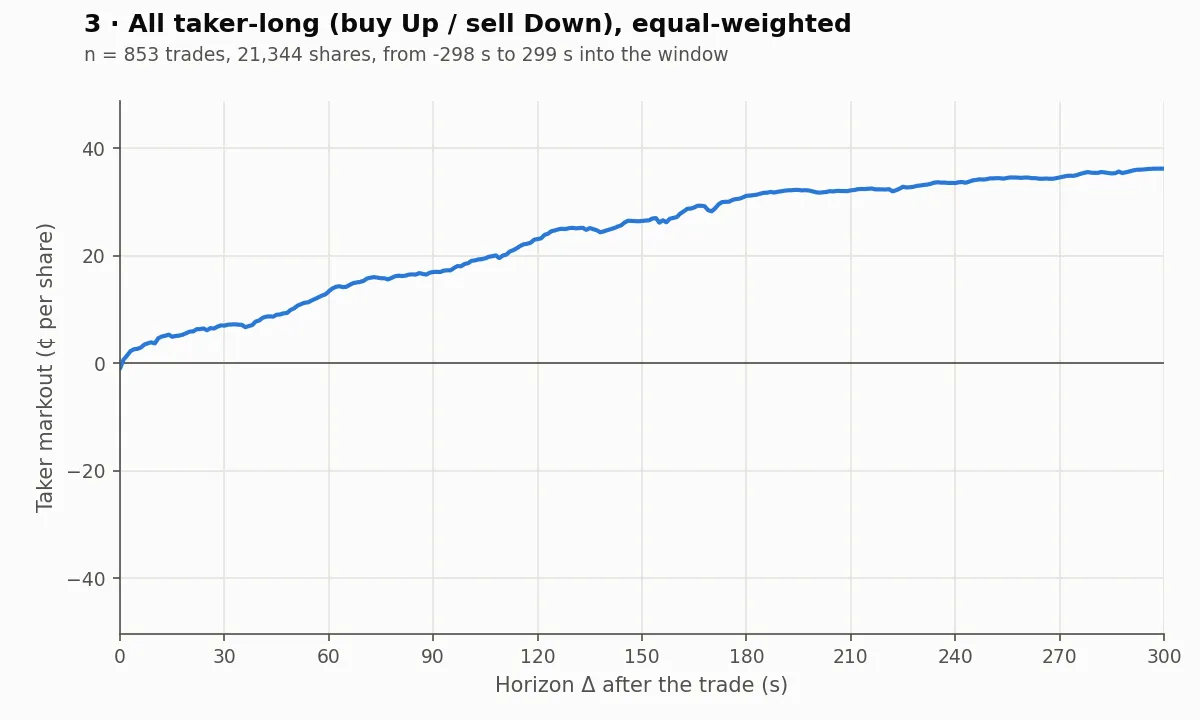
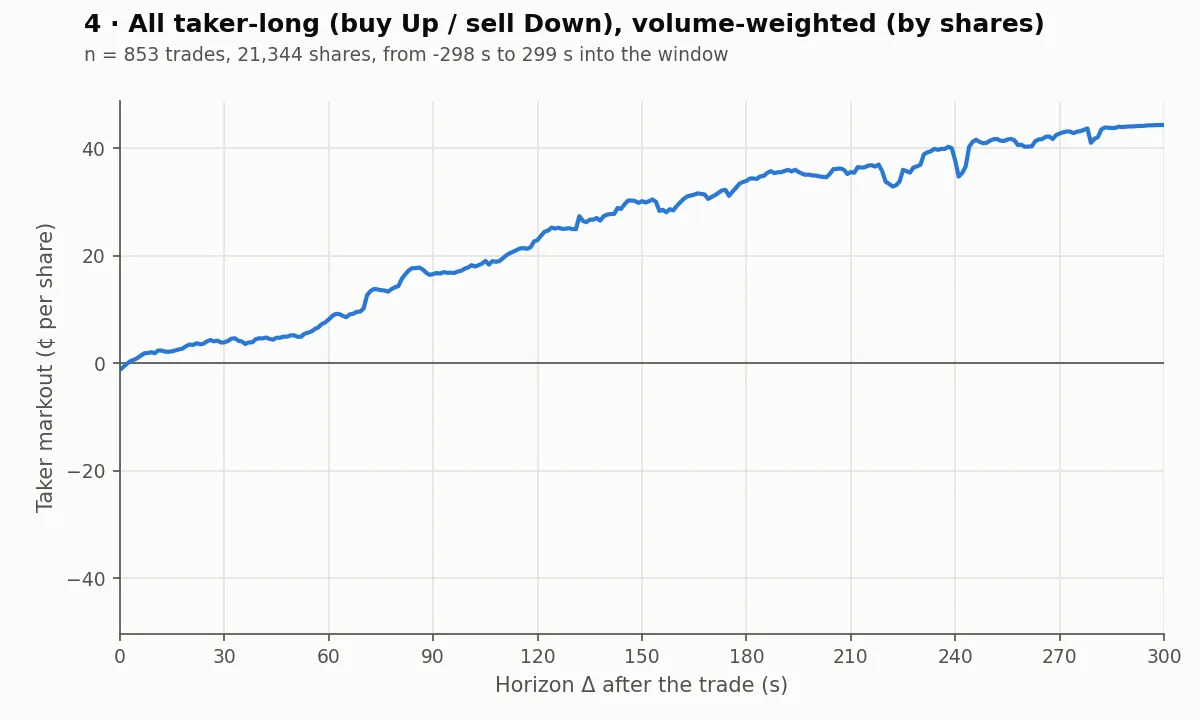
All trades of the cycle, long and short, equal-weighted and volume-weighted. Figures 3–6 share the same vertical scale.
| Figure 3. All taker-long trades (853), equal-weighted. | Figure 4. All taker-long trades, volume-weighted. |
|---|---|
 |  |
| Figure 5. All taker-short trades (732), equal-weighted. | Figure 6. All taker-short trades, volume-weighted. |
|---|---|
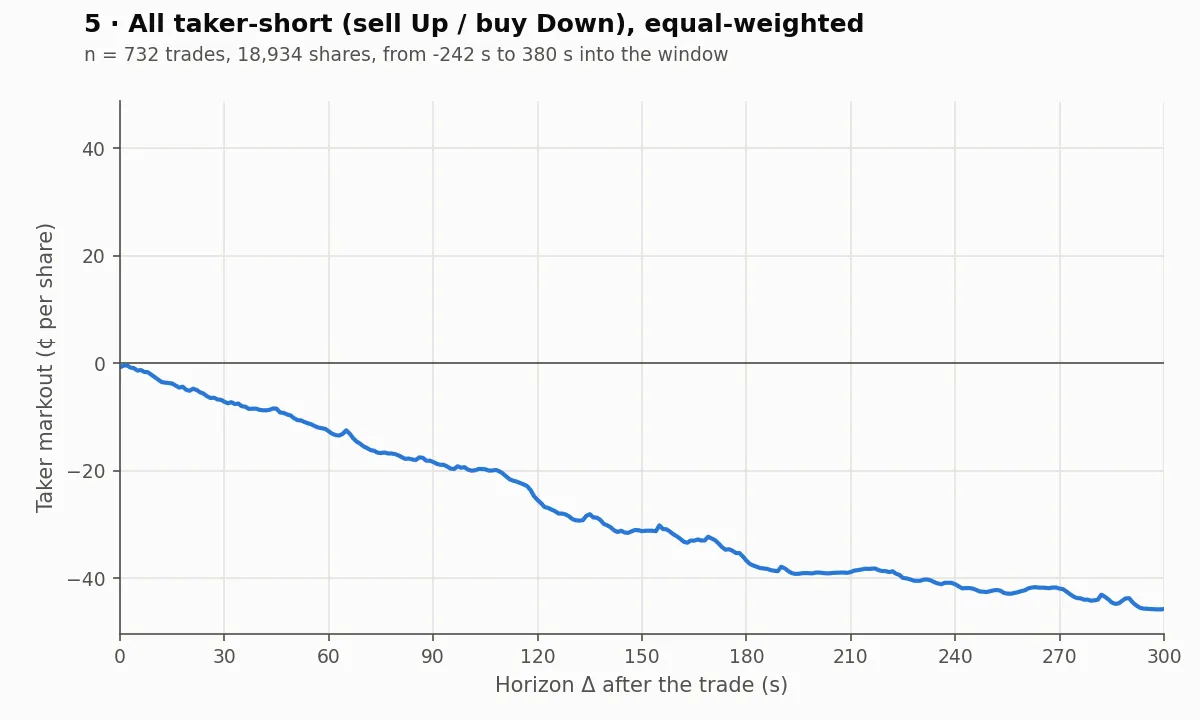 | 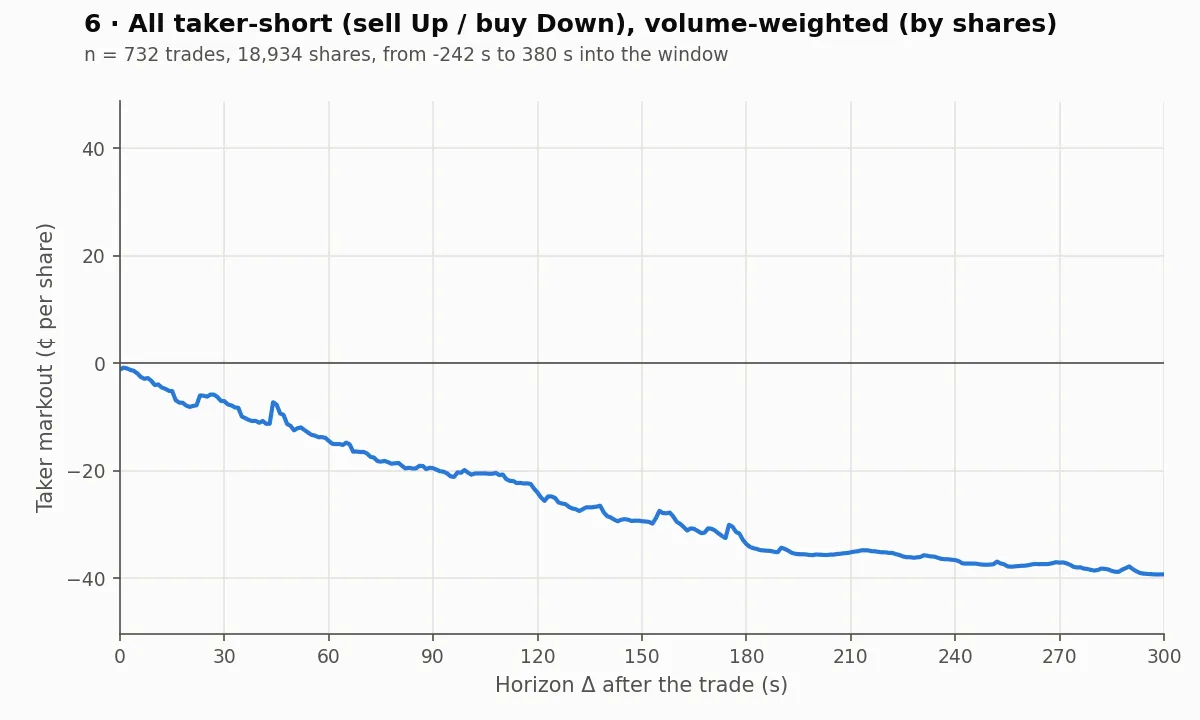 |
What to take from it. Up rose and won, so the long curves climb to about ¢ (equal-weighted) or ¢ (volume-weighted), and the short curves fall to about ¢ or ¢. These end values are mostly the realized payoff of this one cycle, not evidence that takers had information. Trades from the same cycle share one price path and one outcome, so they are not independent and no confidence band is drawn.
5.3 Several cycles pooled#
Trades from all cycles are pooled and averaged together (cycles with more trades get more weight). We do not average cycle by cycle first.
5 cycles (23:00–23:25 UTC, Up won 2 of 5)#
With only five clusters we do not draw confidence intervals.
| Figure 7. 5 cycles, all taker-long trades (2,722). | Figure 8. 5 cycles, all taker-short trades (3,216). |
|---|---|
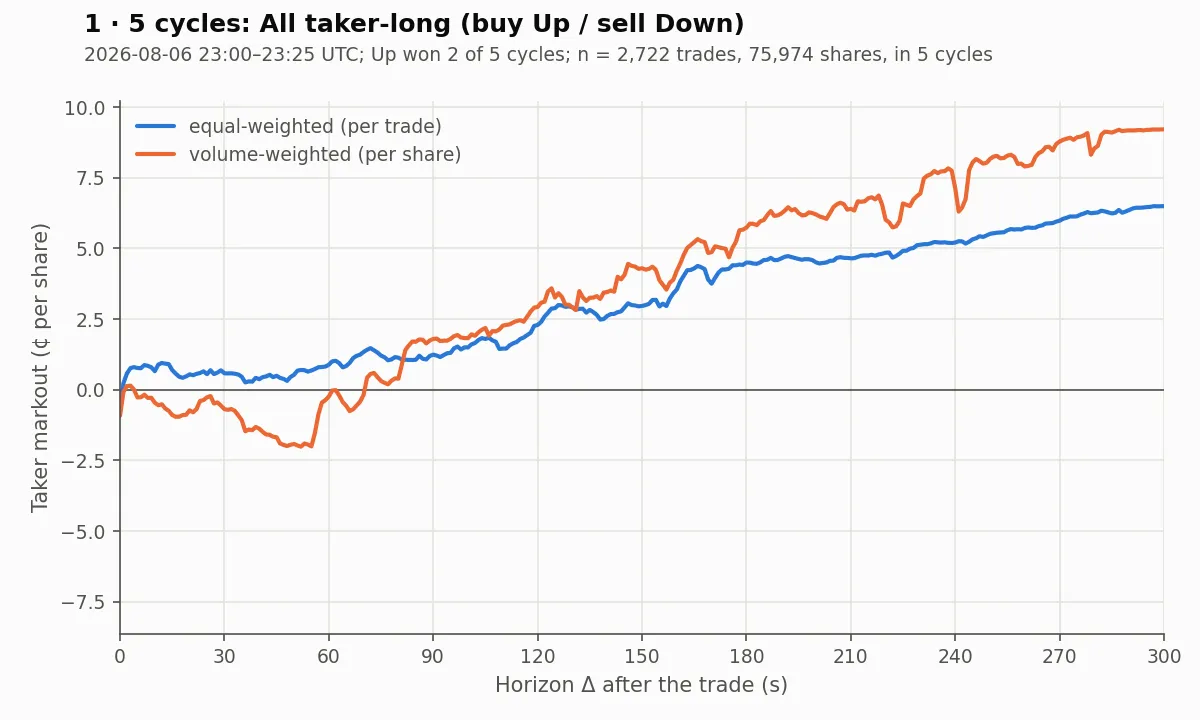 | 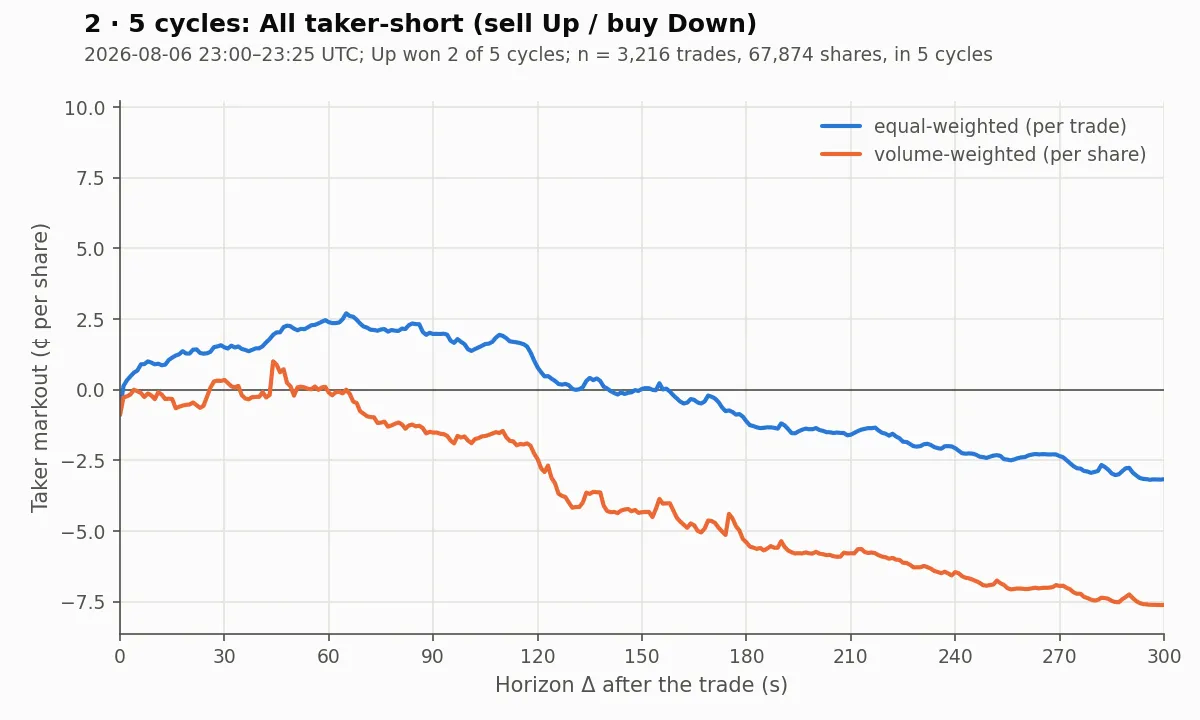 |
The equal-weighted and volume-weighted curves already disagree a lot (at s, long: about 6.5¢ vs 9.2¢; short: about ¢ vs ¢). With so few cycles, a handful of large trades decides the picture.
Wallet 0xe0229e10… is the second-largest taker by volume in these 5 cycles, with balanced long and short trades. We follow it for all its taker trades (54), only its long trades (23), and only its short trades (31).
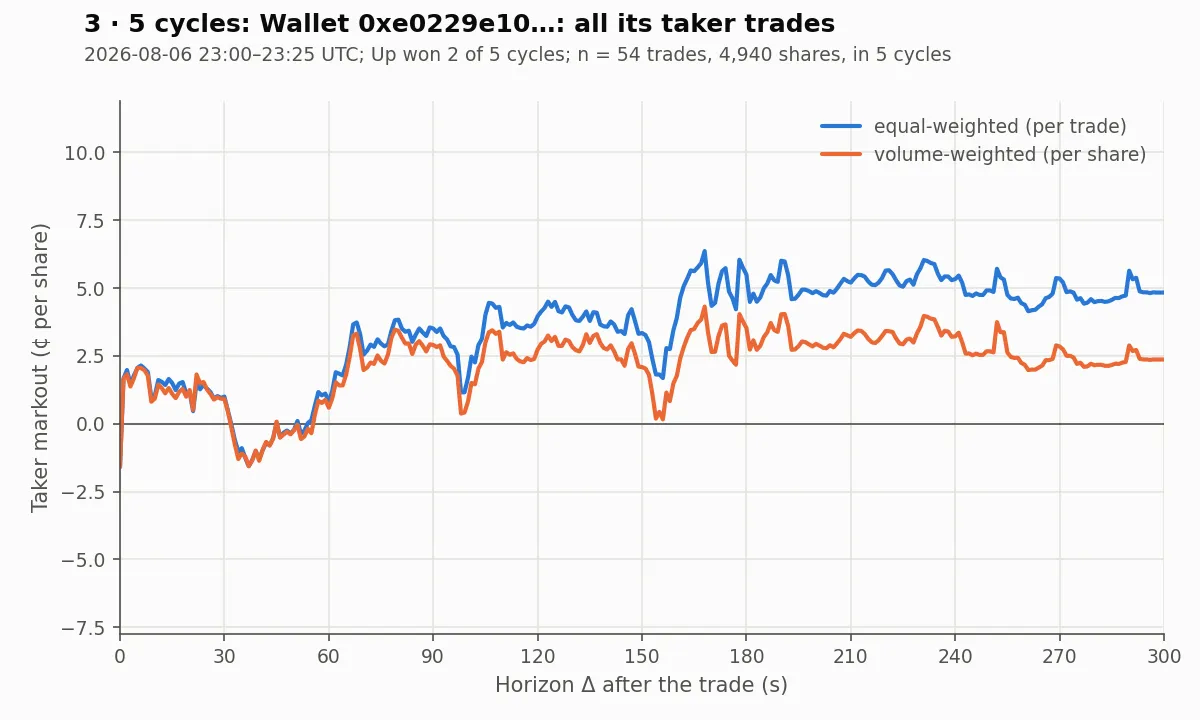
Figure 9. Wallet 0xe0229e10…, all its taker trades.
Figure 10. Wallet 0xe0229e10…, taker-long trades. | Figure 11. Wallet 0xe0229e10…, taker-short trades. |
|---|---|
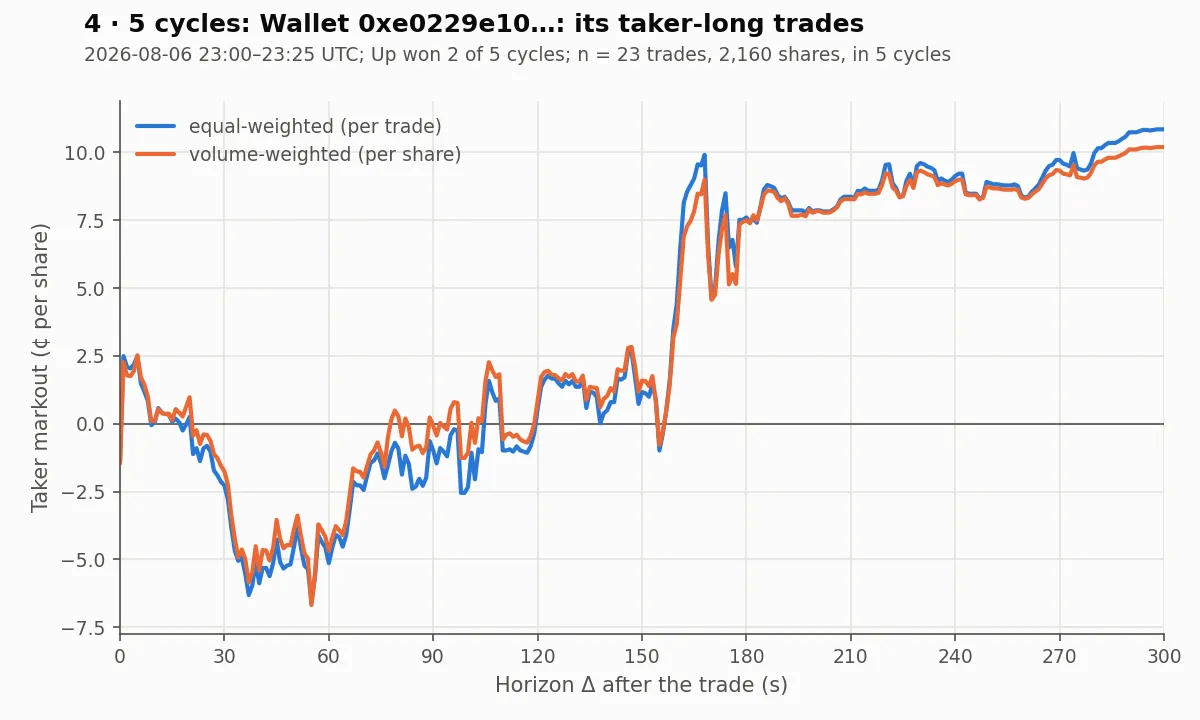 | 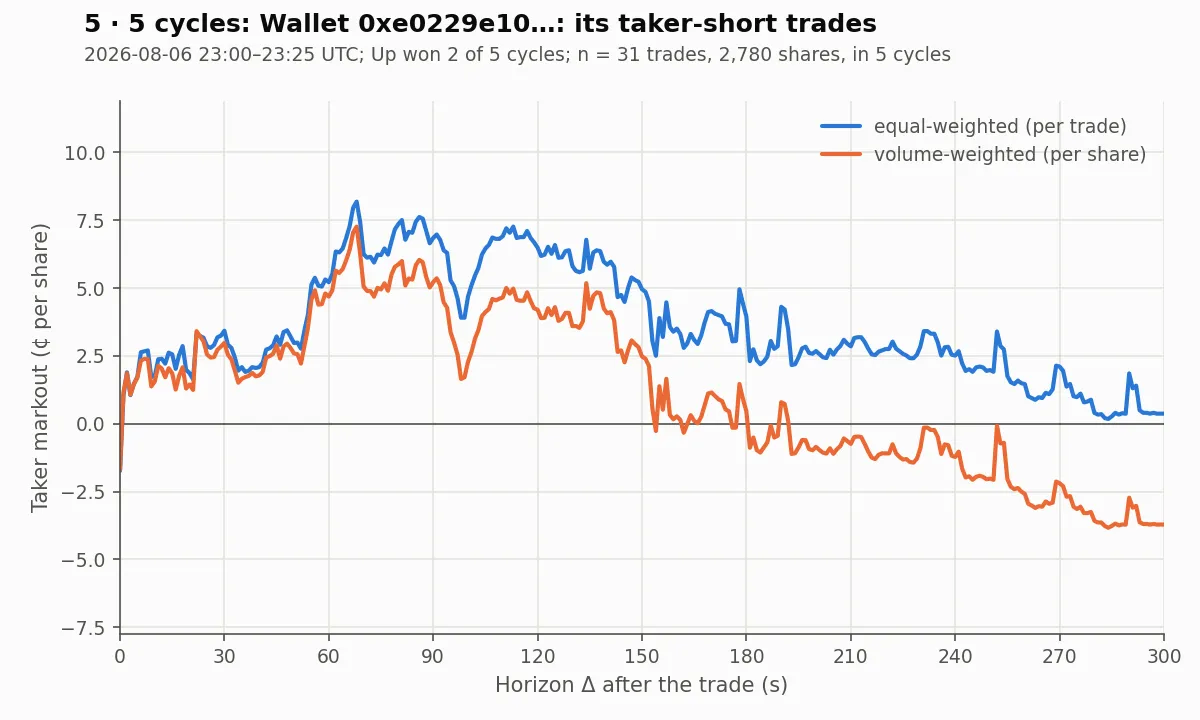 |
The numbers of trades are tiny, so these curves are mostly noise.
288 cycles (2026-08-06, full day, Up won 133)#
| Figure 12. 288 cycles, all taker-long trades (242,937 trades, 7.39M shares). | Figure 13. 288 cycles, all taker-short trades (248,919 trades, 7.37M shares). |
|---|---|
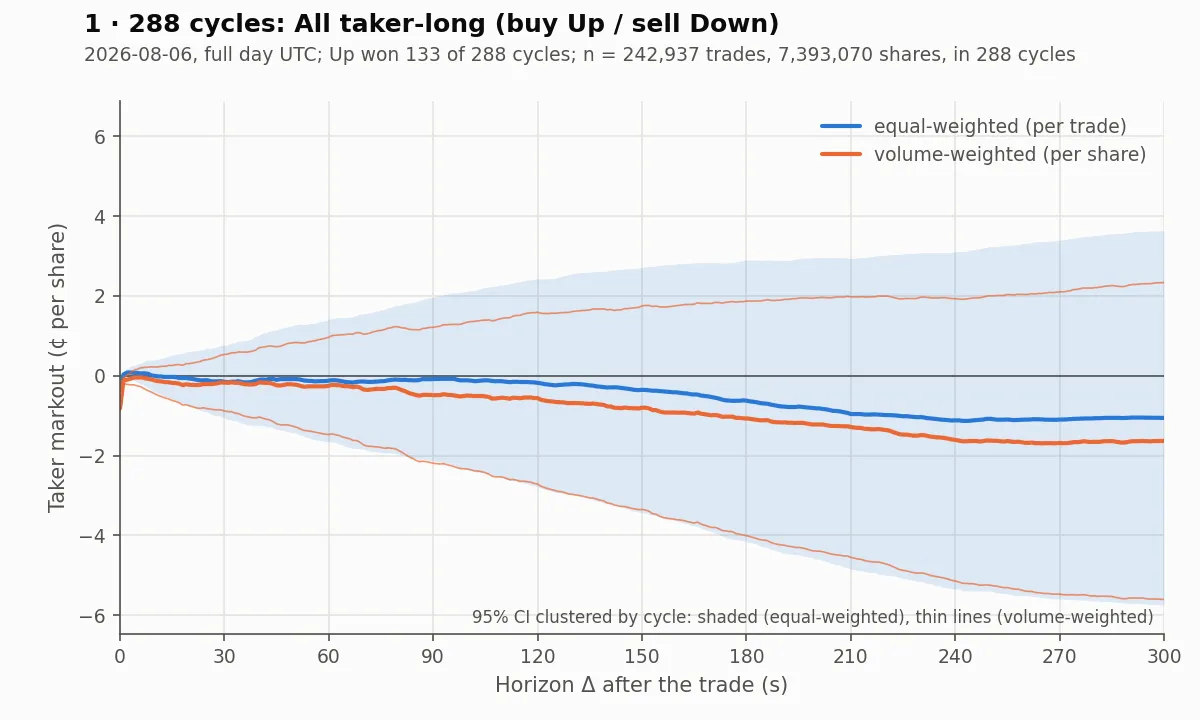 | 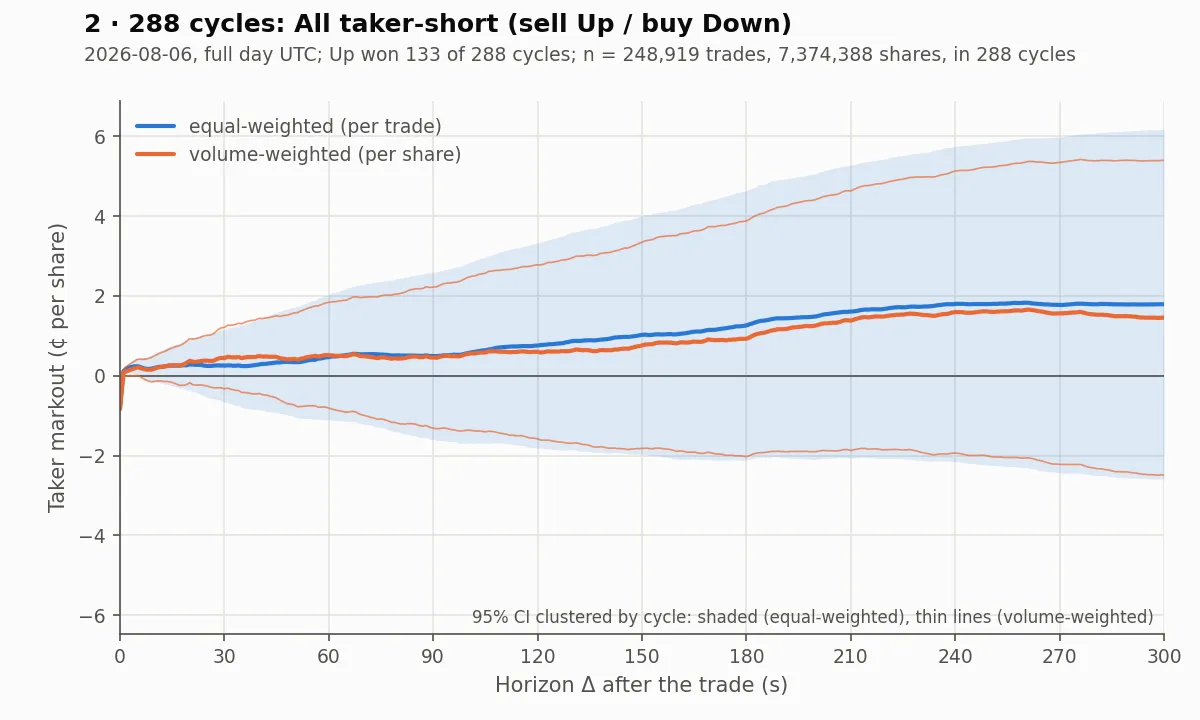 |
- At both curves start at about ¢: the average half-spread paid by a taker.
- Within the first seconds the curves return to about (long about , short about ¢ at s): the price impact roughly offsets the half-spread. This is the qualitative shape the zero-profit model predicts for takers as a group.
- At s, long is about ¢ (equal-weighted; ¢ volume-weighted) and short about ¢ (¢). The signs are what we would expect from Down winning more cycles that day (155 of 288), that is, from drift in the outcome, not from information.
- The 95% bands are several cents wide at long horizons (roughly to ¢ for long at s) and always contain . We cannot reject zero, but with a band this wide, relative to a half-spread of about ¢, the test has little power.
Wallet 0x66b1c3fe…: among wallets with at least 50 trades in each direction, the one with the largest taker volume (2,964 trades, 628,988 shares, active in 176 cycles).
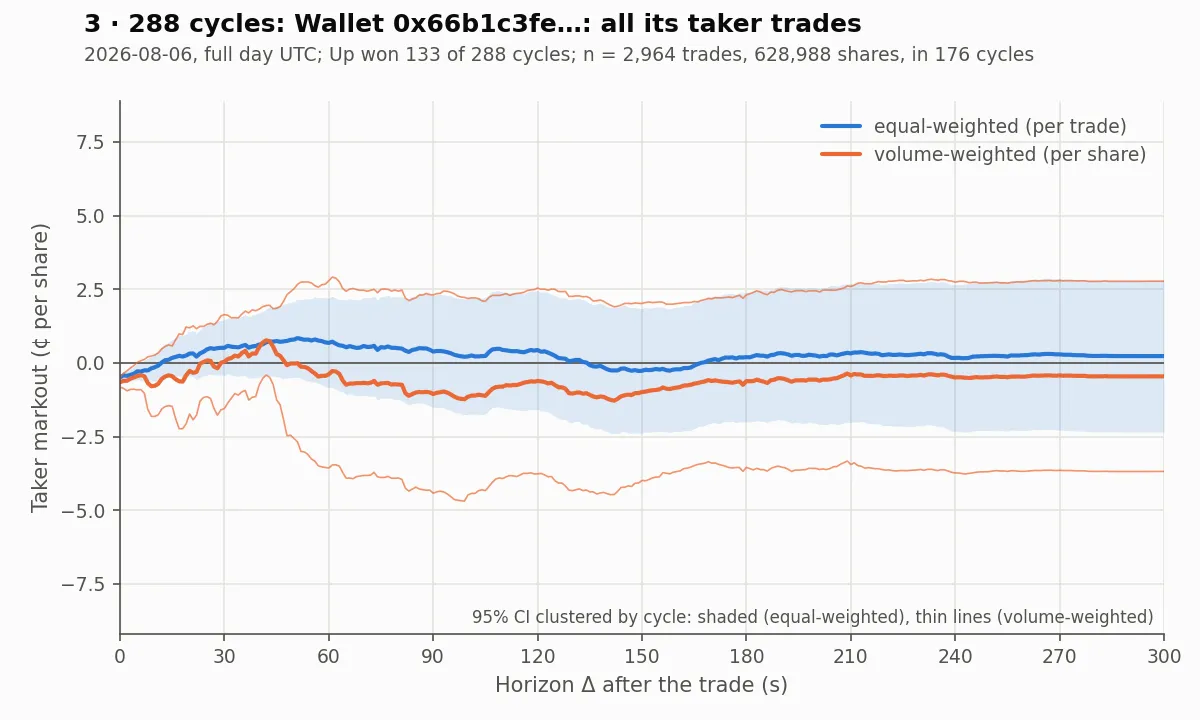
Figure 14. Wallet 0x66b1c3fe…, all its taker trades.
Figure 15. Wallet 0x66b1c3fe…, taker-long trades (1,370). | Figure 16. Wallet 0x66b1c3fe…, taker-short trades (1,594). |
|---|---|
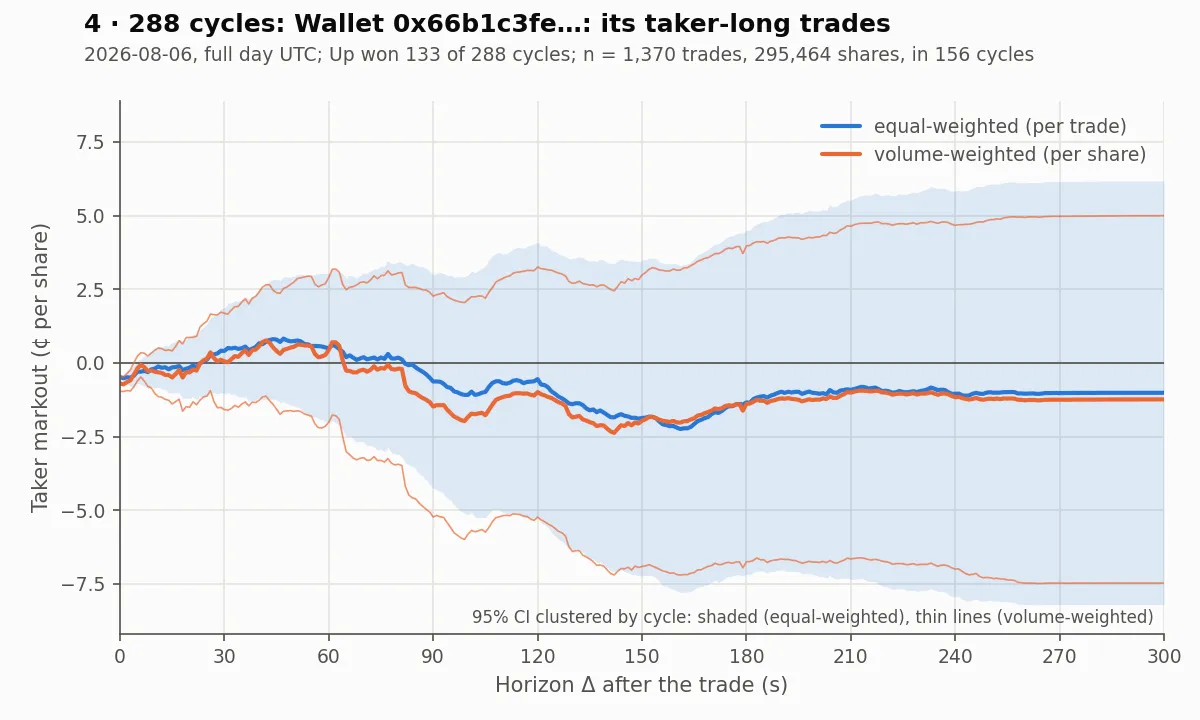 | 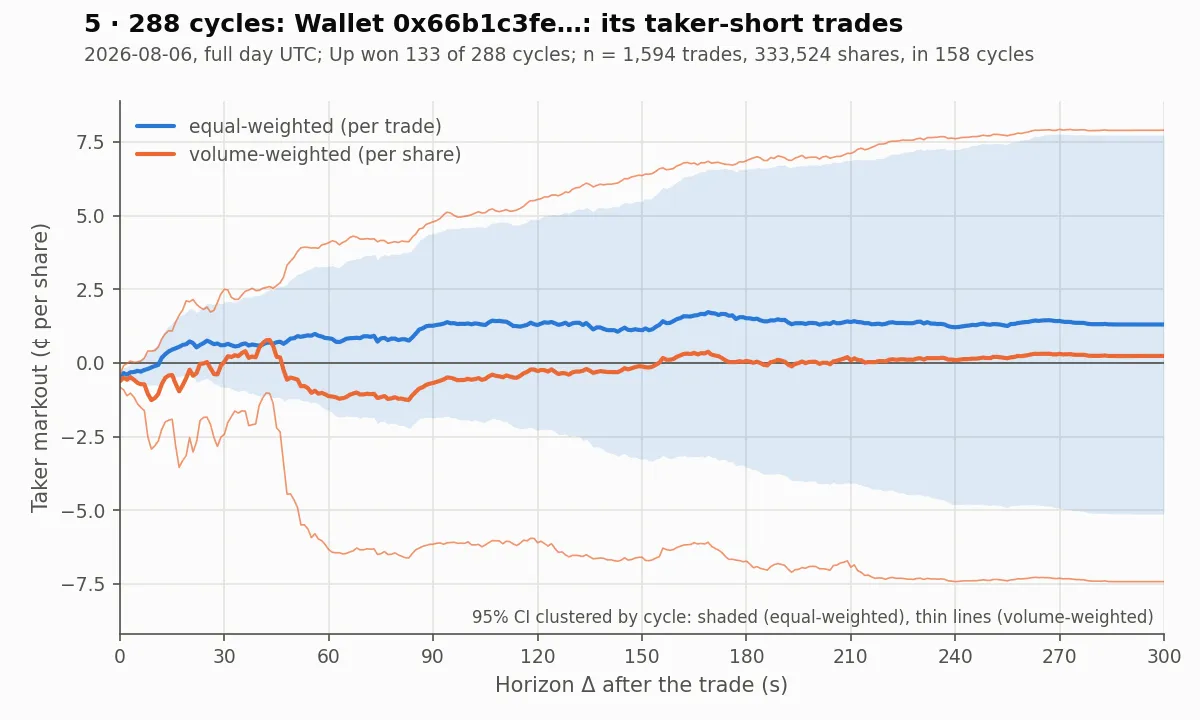 |
For all trades, the equal-weighted curve stays near (about ¢ at s) and the volume-weighted curve near ¢, with bands that contain throughout (the volume-weighted band is wider). The long and short curves separate somewhat but their bands are even wider. On this day there is no detectable edge for this wallet. It was chosen by volume, not by its markout, so there is no selection on the outcome.
5.4 Caveats and next steps#
- Gross of fees. The settlement-manipulation paper says the 5-minute contracts charged takers a fee from launch, peaking at even odds. I have not checked the fee on 2026-08-06, and it may be of the same order as the 0.8¢ half-spread.
- One day. Cycles on the same day share one market environment, so clustering by cycle may understate the uncertainty. More days are needed.
- Long and short are plotted separately. The zero-profit condition is about all takers together, so the next step is a single curve with long and short pooled, in which the drift of the day largely cancels.
- Large is not a pure mid-price markout. For trades near the close, a large part of the horizon is after settlement, where is replaced by . The curve then moves toward the unbiased payoff .
- Fills vs orders. It is not stated whether several fills of one taker order are merged into one trade. A marketable order that walks the book should be one observation.
- Dropped trades.
wrong_sidetrades are concentrated in the most volatile seconds before the close, which are exactly where informed or sniping trades are most likely.